

For years, I’ve been on a mission to understand what really makes a bike feel comfortable – and to keep things objective, I’ve been gathering vibration data to help evaluate bikes and gear more accurately.
At first, I used a smartphone and a vibration app to measure how bumpy different bikes felt on various trails. That worked surprisingly well, but I’ve now stepped things up with a much more precise way to test comfort.
My New Vibration Measurement Procedure
With my new outdoor testing setup, I’m getting results that are:
- Consistent no matter the weather – hot, cold, dry, or wet
- Easy to compare across different days, which makes benchmarking way more reliable
- Measured directly on the bike (not the rider), so we remove the natural damping effect of the human body
- Collected at real-world gravel riding speeds (20–25 km/h)
The best part? These results line up really well with my earlier outdoor and treadmill comfort tests, so I know the data’s solid.
Front and Rear Vibration Measurements
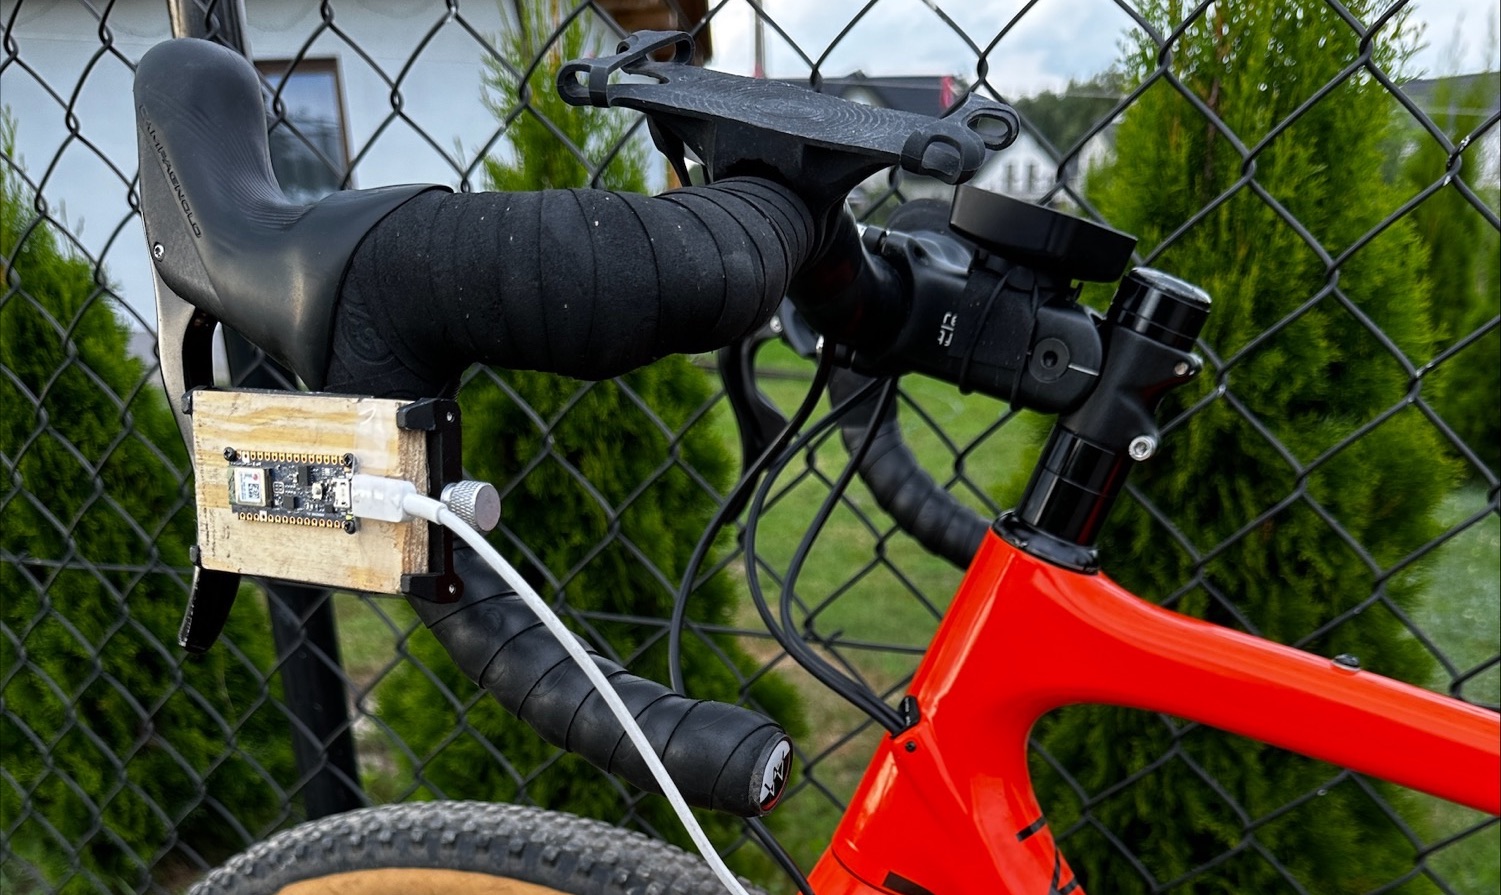
I’m using an Arduino Nano BLE 33 accelerometer, powered by USB, to gather super detailed vibration data at 500 Hz. With some help from the developer behind the Vibration Analysis app, I was able to fine-tune the setup specifically for comfort testing.
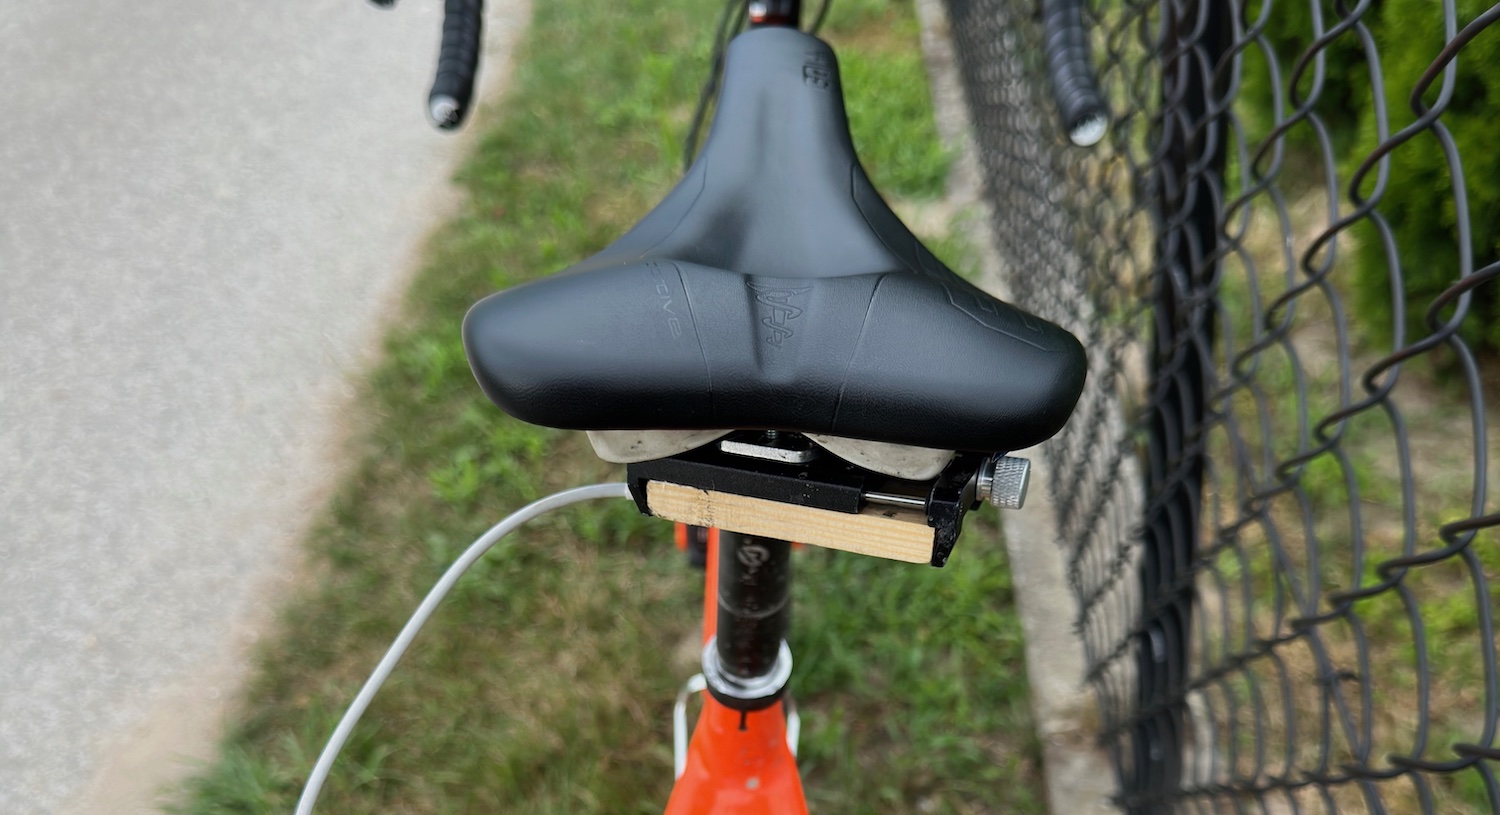
The sensor is mounted under the brake hoods and the saddle, which means I’m measuring the bike itself – not the rider. That way, we get a clear picture of how comfortable the front and rear of the bike really are, without the rider’s body absorbing or masking the vibrations.
Benchmark Bike Setup
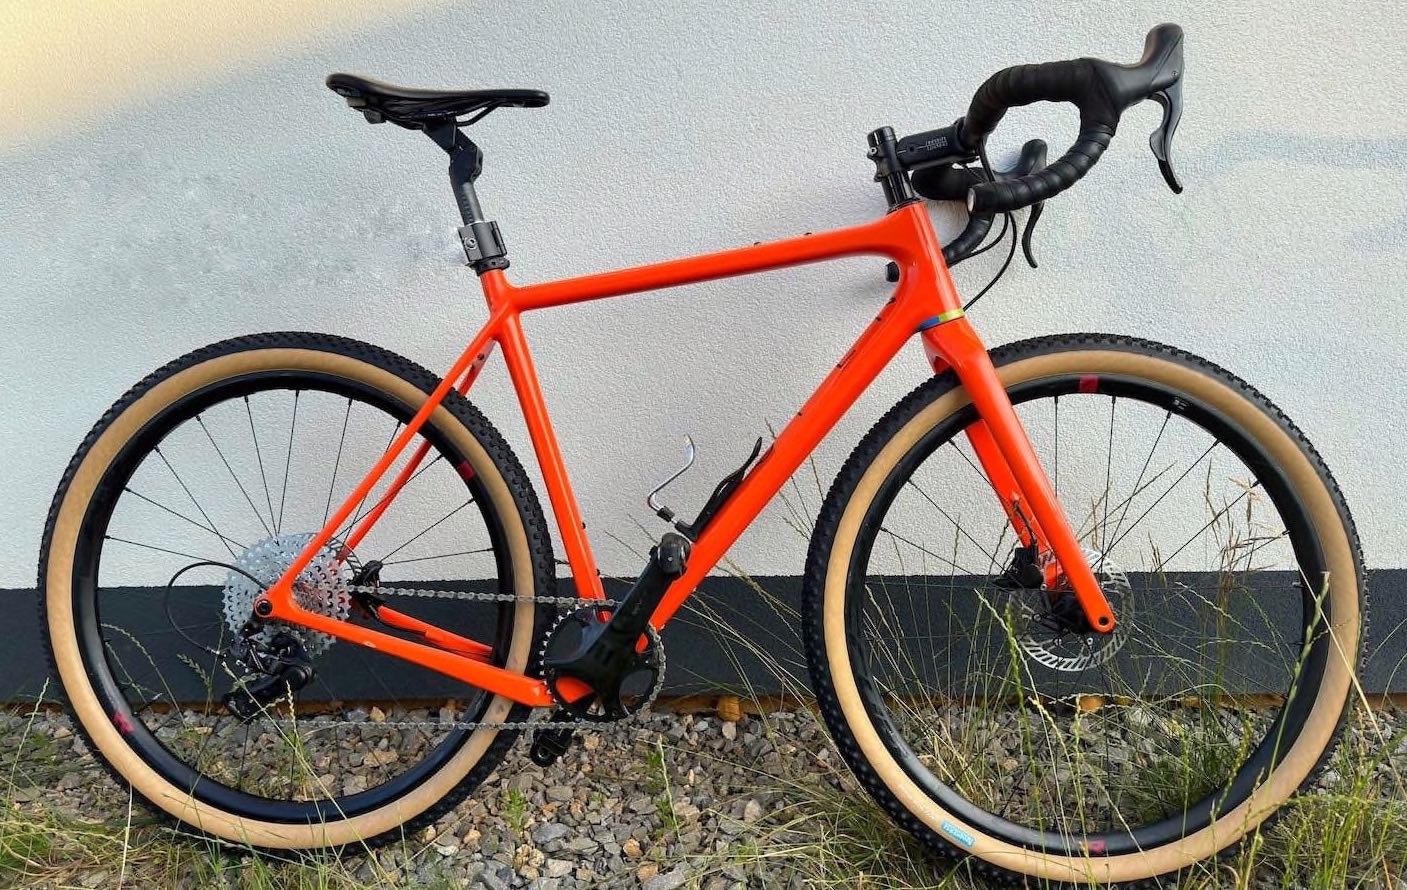
I’m using my Open WI.DE as the benchmark bike to compare different bikes and components.
It’s running Rene Herse Umtanum Ridge 650B x 55 mm tires, pumped up to a relatively high 35 PSI (2.5 Bar). That higher pressure helps minimize the tires’ influence on the vibration readings, so the results focus more on the bike and setup.
When I switch to tires with different widths, I adjust the pressure using Laplace’s law to keep the tire casing tension consistent across tests. The basic idea is that casing tension equals internal pressure times tire radius – so wider tires need lower pressure to match the tension of narrower ones. This keeps things fair and comparable.
Big Hit Test
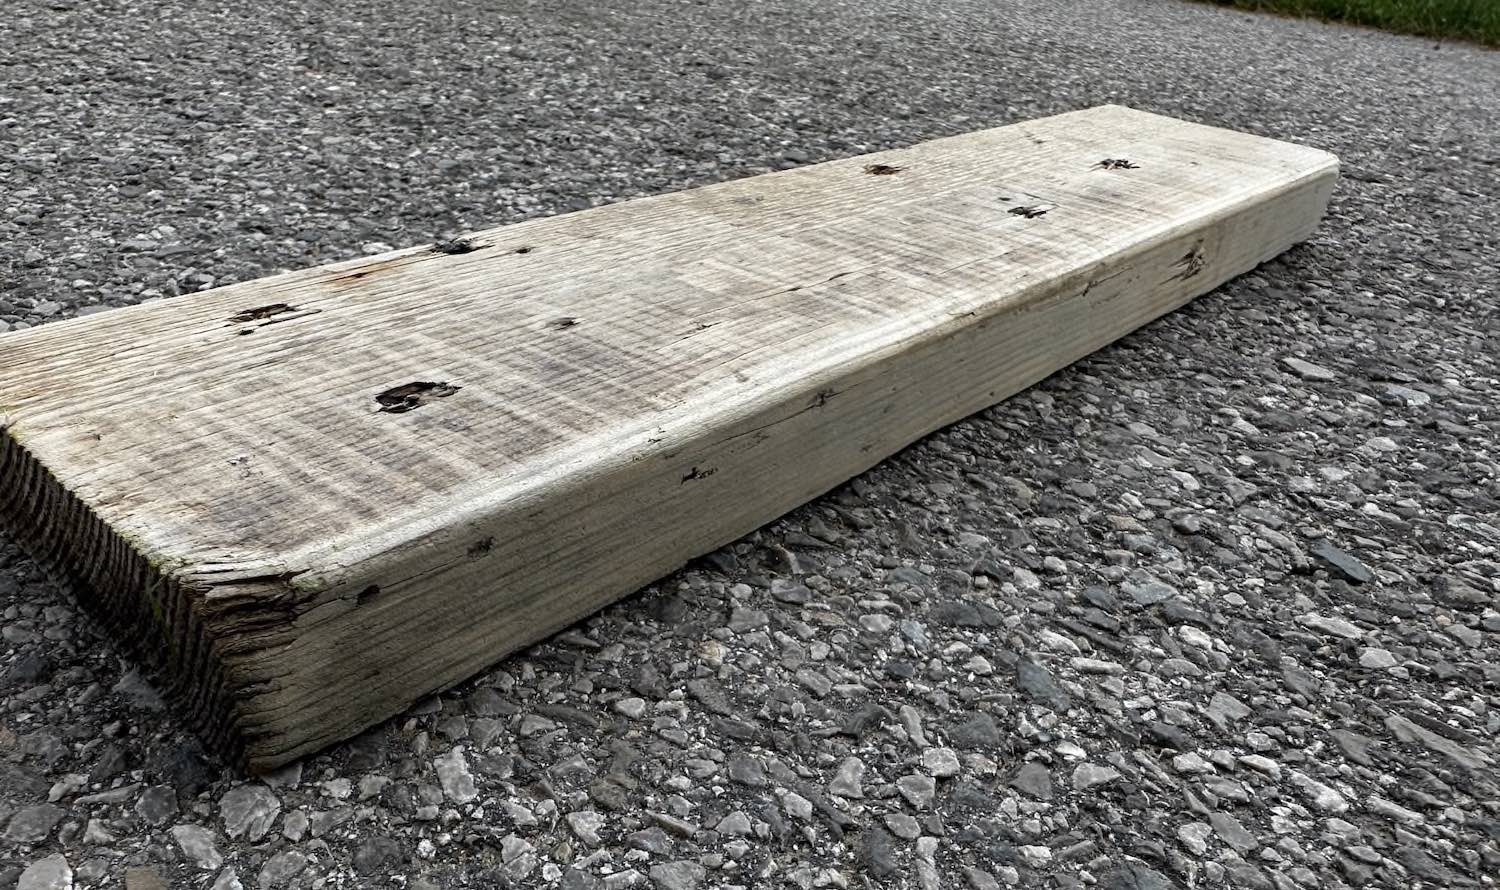
To see how a bike or component deals with a big hit, I place a single wooden block (50mm long, 30mm high) on smooth asphalt.
I then ride over it at 20 km/h, staying seated and not pedaling, to capture one clean bump event while recording the vibration data.
Fast Gravel Road Test
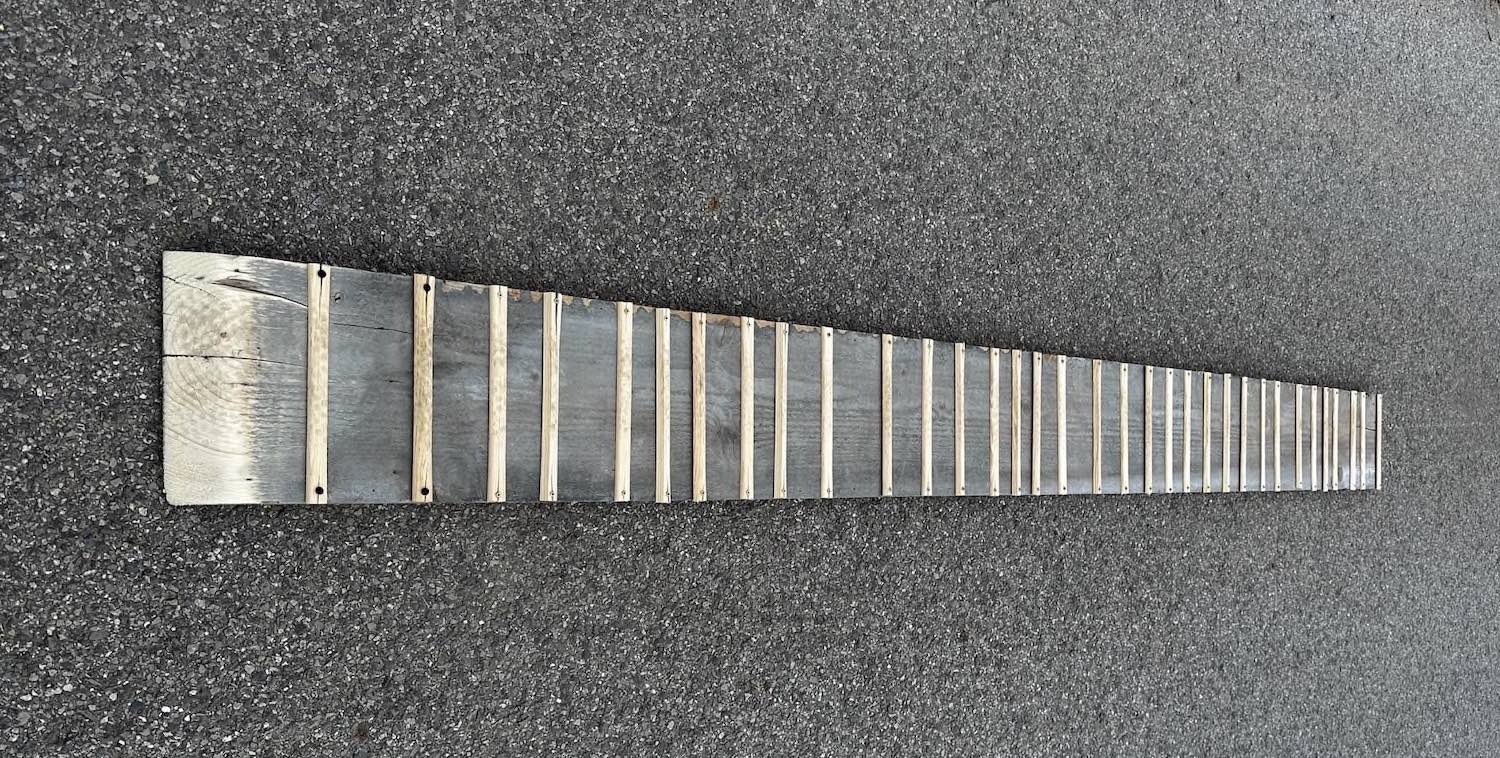
To test how well a bike or component smooths out fast gravel chatter, I use a 300 cm (118″) long obstacle with 34 wooden slats spaced randomly. It creates enough high-frequency bumps to mimic a real gravel road.
Like with the big hit test, I ride over it at 25 km/h, stay seated, and don’t pedal while collecting the vibration data.
This test also includes a larger impact right at the start (when I first roll onto the obstacle) so it doubles as a broader performance test. I skip the data from the end of the obstacle since the drop-off isn’t consistent across runs.
Multiple Test Runs
For each test scenario, I do nine runs.
To keep things consistent and minimize the impact of any small speed changes, I toss out the two highest and two lowest readings. Then I average the remaining five runs – that’s the data you see in the results.


